
By summerstudent Sumedha Ravishankar >
You can liken PDFs to people. You have your inner circle of friends and then the ones you speak to sometimes and, eventually, those you will never meet.
Maybe I should explain what I mean by PDF… and no, not the file format. PDF stands for pair distribution function. It’s a way to describe how atoms are arranged around one another. Imagine picking one atom and then measuring how many other atoms are a certain distance away – that’s what a PDF graph shows. The x-axis is the distance, and the y-axis is the number of atoms at that distance.
For example, if I were a central atom right now, my PDF would have a big peak for the summer students around me – a tight cluster at a close distance.

The “rainbow HZB stall”
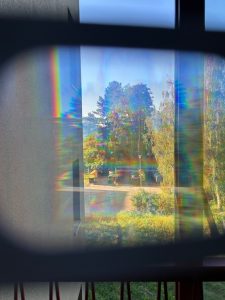
Recently, a pair of us visited the Helmholtz-Zentrum Berlin (HZB) stall at an LGBTQ+ event here in Berlin. Alongside the rainbow HZB merchandise were a pair of “spectral” glasses – the kind that turn white light into rainbows. I hadn’t seen those since I was a kid.
These glasses work because of thin-film interference, a phenomenon where two light waves that are out of sync create patterns of brightness and darkness. In this case, it creates rainbow fringes – and oddly enough, this is conceptually similar to what happens in neutron scattering.
Neutron scattering for materials science
Neutron scattering is one of the techniques used to study the structure of materials. Neutrons behave like waves, and when they scatter off a material, they interfere with each other, creating a pattern of dots. This pattern exists in what scientists call “reciprocal space,” where the distances between the dots are inversely related to the actual atomic distances in the material.
From reciprocal to real space
By applying a mathematical tool called the Fourier transform, we can convert that reciprocal space data into a real-space PDF – the one that shows how atoms are positioned relative to one another.
But figuring out how atoms are arranged isn’t always as simple as looking at a neat pattern. In ideal materials, the atoms are perfectly ordered over long distances, and you can spot that order through sharp, clear signals (called Bragg peaks) in the data. But most real materials, especially the ones we use in real-world technologies, aren’t so perfect. Their atoms might be slightly off, shifted, or disordered in small ways (this is called local disorder) that don’t show up in the traditional analysis.
Why we need the pdf:
That’s where the pair distribution function becomes useful. Instead of only showing the big, obvious patterns (the long-range order), it helps us see the smaller, local details (the short-range order) – what’s happening between just a few atoms at a time. And those small differences have a large effect on how the material behaves.
In my project, I’m studying materials called piezoelectric ceramics, which can respond to electric fields – a bit like how some phone screens or sensors work. The materials I’m looking at are five ceramic materials (Pb(Mg1/3Nb2/3)O3-PbTiO3) which are doped with different rare-earth metals, two of which are Lanthanum and Samarium. The goal is to understand how to tune the piezoelectric properties by doping the ceramics.
These compounds look very similar when you zoom out, but when you zoom in and examine the short-range structure using the PDF, there are important differences. By comparing them, I’m learning how even tiny changes in atomic arrangement can affect useful properties – like how well a material can convert mechanical pressure into electricity (a property called piezoelectricity).
About the author: Sumedha Ravishankar is a student at Queen Mary University of London, studying Chemistry. During the ISSP2025, she works in the group of Quantum Phenomena in Novel Materials in the topic of atomistic studies of ferroelectric materials.